One way that business valuation
professionals can calculate the value of a business is by comparing it to
publicly traded companies whose value has been established by the market. But
how realistic is it to compare an independent five-store hardware chain – if
such a thing exists these days – to Home Depot and Lowe’s?
In an article first published in the August/September edition of Financial Valuation and Litigation Expert, William Quackenbush, director of Advent Valuation Advisors, explains the process of adjusting a guideline public company’s market multiples when valuing a closely held business. Click the link below to read “Quantitatively Adjusting Guideline Public Company Multiples.”
Divorce cases involving family businesses can pose unique challenges. Photo by Kelly Sikkema on Unsplash
A
Connecticut appellate court recently delivered a resounding rebuke to a trial
judge for “double-dipping” in a divorce case.
The court hearing
the appeal in Oudheusden v. Oudheusden determined that the trial judge acted
unfairly in dividing the couple’s assets and setting alimony, despite warnings
from the lawyers for both sides regarding the risk of double-dipping.
According
to the appellate decision, Mr. Oudheusden built two businesses during the couple’s
decades-long marriage, and they represented his only sources of income. The
trial judge awarded Mrs. Oudheusden $452,000, representing half the fair market
value of the two businesses, as well as lifetime alimony of $18,000 per month.
In its decision, the appellate court stressed that the lump sum award and the stream of alimony payments were drawn from the same source.
“We agree
with the defendant that, under the circumstances of this case, the court
effectively deprived the defendant of his ability to pay the $18,000 monthly
alimony award to the plaintiff by also distributing to the plaintiff 50 percent
of the value of his businesses from which he derives his income,” the decision
reads. “The general principle is that a court may not take an income producing
asset into account in its property division and also award alimony based on
that same income.”
Second bite of the apple
In divorce
cases where the assets include a business, the value of the business and its
profitability are key considerations in dividing the estate. In Oudheusden v.
Oudheusden, the judge sided with the wife’s valuation expert in determining
that the businesses were worth a total of $904,000, and that the husband’s
annual gross income from them was $550,000.
Under the
income approach to valuing a closely held business, the valuation is derived by
calculating the present value of future benefits (often cash flow or some
variant thereof) that the business is expected to generate. First, the
business’s operating results are adjusted, or normalized, for nonrecurring or unrealistic
items. In many small, closely held businesses, it is not unusual for the amount
of compensation the business pays to its owner-operator to be motivated by tax
considerations. In such a case, a business appraiser should normalize the
owner’s compensation to reflect a fair market salary for the owner’s job
duties. This formalizes the distinction between the reasonable compensation for
the owner’s efforts and the business’s return on investment after deducting
that compensation.
Next, a
multiple of the normalized earnings is calculated based on the perceived risk
to the company’s future performance and the expected growth rate of its
earnings. The result of that calculation represents the present value of the
future benefits to be generated by the business.
When a
couple gets divorced, a judge who awards the nonowner spouse half the value of
the family business has in essence given that spouse half of the future
benefits to be generated by the business, discounted into today’s dollars.
Awarding alimony based on a percentage of the same future benefits to be
generated by the business would be taking a second bite from the apple, since
that stream of benefits has already been divided.
Mrs. Oudheusden’s
attorney explained the concept nicely in his closing statement, when he warned
the judge of the perils of double-counting a single stream of income:
“Whatever
value the court attributes to the business, the court has to, and should back
out a reasonable salary for the officer and owner of the company. Because if
the court is going to set a support order based on his income, it would not be
fair and equitable to also ask that he pay an equitable distribution based on
that as well,” he said. “That would be double-dipping.”
Decision reversed
After the trial court issued its decision, Mr. Oudheusden filed a post-judgment motion for clarification, asking if the judge considered $550,000 to be his income from his businesses, or his earning capacity if employed elsewhere. The judge responded that the figure was not a measurement of earning capacity, but rather of income from the two businesses.
The
appeals court found that the trial judge “failed to take into account that the
defendant’s annual gross income was included in the fair market value of his
businesses.”
The
appeals court also took issue with the trial court’s award of non-modifiable,
lifetime alimony, because it barred Mr. Oudheusden from seeking a modification
if he became ill or decided to retire, or if his businesses saw a reduction in their
earning capacity. But that is a topic for another day.
The
appeals court reversed the trial judge’s financial orders in their entirety and
returned the case for a new trial on those issues.
The
doctrine against double-dipping is largely settled law in many states,
including New York, where a substantial body of case law has refined its
application to various scenarios, such as the acquisition by one spouse of a
professional license during the marriage. Notable cases include McSparrow v.
McSparrow (Court of Appeals, 1995) and Grunfeld v. Grunfeld (Court of Appeals,
2000). That said, attorneys and valuation professionals who work in the
matrimonial arena should be aware of the potential for a poorly executed
valuation, or a misguided judge, to tilt the scales of justice.
Advent Valuation Advisors has a wealth of experience and a variety of research tools and resources at its disposal to help determine the value of a business and a reasonable salary for its owner-operator. For more information, contact Advent at info@adventvalue.com.
Which of
these businesses do you think is riskier: A pizzeria on a busy street in some
village’s downtown business district, or a company with five pizzerias at
similar locations in five villages?
Chances are,
the single-location business faces more risk. Think of the effect a broken
water main would have on the day’s receipts, or the impact a new competitor
might have on foot traffic. Larger businesses tend to have more diversified
products, suppliers and customers, all of which mitigate risk.
Why is risk
important in business valuation? Because there is an inverse relationship
between risk and value. The greater the risk, the lower the value. That’s why
business valuation professionals often apply a size premium, also known as a
small-company risk premium, to capture the risks and the corresponding additional
returns investors expect to earn from the stock of small companies versus larger
ones.
How does this principle apply to small-business valuations?
In order to shed some light on this question, we analyzed data for small, private-company
transactions from 2003 to 2017 provided by Pratt’s Stats Private Deal Update for
the second quarter of 2018 (also known as Deal Stats Value Index). Valuation
professionals commonly employ these transactions to derive benchmark ratios, or
multiples, for use in the market approach to valuation.
One such earnings multiple is MVIC/EBITDA. This is the ratio of the market value of invested capital (think “sale price”) to earnings before interest, taxes, depreciation and amortization, where invested capital equals equity plus debt. A business with $250,000 of EBITDA that sells for $1 million has an MVIC/EBITDA multiple of 4.
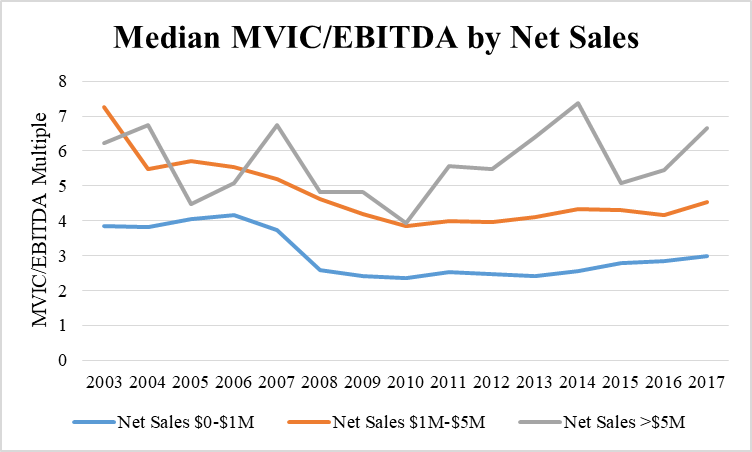
Private Deal Update provides median MVIC/EBITDA data by year
from 2003 to 2017 for companies in three net sales ranges: up to $1 million, $1
million to $5 million, and greater than $5 million.
The chart clearly shows that companies with the lowest net sales garnered significantly lower EBITDA multiples than did companies in the middle and upper sales ranges. Companies in the highest revenue range tended to sell at the highest multiples, with the distinction more pronounced since the end of the Great Recession. In 2017, the most recent year available, the largest companies sold at a median of 6.7 times EBITDA, compared to 4.5 times EBITDA for the middle range and 3 times EBITDA for the smallest companies.
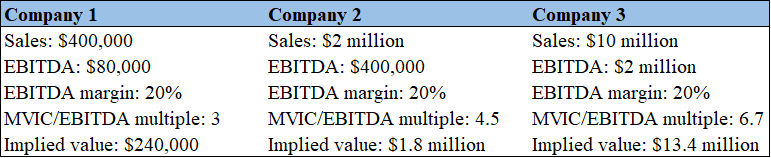
Consider a scenario in which those MVIC/EBITDA multiples are applied to three fictitious companies, each of which has a 20 percent EBITDA margin:
All three companies exhibit the same degree of profitability as measured
by EBITDA margin, but the small company’s implied value is just 60 percent of
annual sales, while the large company’s implied value is 134 percent of annual
sales.
The data provides a strong endorsement for the application of a size premium in transactions involving small businesses. As is often the case with sweeping pronouncements, however, there are caveats to bear in mind. We’ll leave you with a few:
The smallest companies in the dataset – those with up to $1 million in annual sales – tended to be more profitable than larger companies. This might mitigate, to some degree, the effect of their lower multiples.
There are many other factors beyond size – and beyond the scope of this article – that can affect a company’s valuation multiples.
And finally, the Private Deal Update data includes a melting pot of transactions in a variety of industries, from manufacturing to retail to IT. Each of these industries is made up of numerous subdivisions, each with unique characteristics, financial and otherwise.
Here at Advent, we won’t casually apply a broad analysis, but will drill down into the data to consider these unique characteristics and their impact on risk, and therefore value.
For more information, contact Advent Valuation Advisors at 845-567-0900
or info@adventvalue.com.
Ever wonder why a startup company that hasn’t turned a profit and may not even have a clear path to generating one can command a billion-dollar valuation?
What drives the value of these unicorns? Why are early investors so eager to pour money into them? Antonella Puca talks about the challenges of unicorn valuation and the importance of intangibles at aicpa.org.
Business Brokers Note Dip in Seller Confidence in First Quarter
Seller sentiment declined during the first quarter in four out of five price segments below $50 million, according to a survey of business brokers and M&A advisors. Photo by rawpixel.com from Pexels
It’s still a seller’s market, but the balance of power in business transactions has begun to shift, according to the latest edition of Market Pulse, the quarterly survey of business brokers conducted by the International Business Brokers Association and M&A Source.
The national survey is intended to capture market conditions for businesses being sold for less than $50 million. It divides that market between Main Street businesses with values of $2 million or less, and lower middle-market ones in the $2 million to $50 million range.
The report for the first quarter of 2019 describes a robust market in which sellers of businesses hold the advantage in all segments except the smallest (under $500,000). But it also notes that seller confidence declined over the preceding year across all market segments except for the $5 million to $50 million value range.
A seller’s market is reflected in seller confidence in excess of 50 percent.“Although it is still a strong seller’s market with strong values, this is the first time in years that we’ve seen four out of five sectors report a dip in seller market sentiment,” said Craig Everett, PhD, who is quoted in the report. Everett is director of the Pepperdine Graziadio Business School’s Private Capital Markets Project, which compiled the survey’s results. “This is a sign the market has peaked, and more people are expecting a correction in the year or two ahead.”
The first-quarter survey of 292 business brokers and M&A advisors was conducted from April 1-15.
Other takeaways from the report include:
Larger companies are selling at higher multiples than smaller ones. During the first quarter, sales for less than $500,000 carried a median multiple of price to seller’s discretionary earnings of 2.0. Businesses in the $1 million to $2 million range sold for three times SDE. The median EBITDA multiple paid for businesses in the $2 million to $5 million range was 4.3, compared to the median multiple of 6.0 for businesses in the $5 million to $50 million range.
Larger companies tend to sell for a greater percentage of asking price. Lower middle-market companies ($5 million to $50 million in value) sold for 101 percent of the asking price or internal benchmark. Small Main Street companies (less than $500,000) sold for 85 percent of asking price.
One reason for the difference: Larger companies are more likely to attract interest from private equity or synergistic buyers, according to David Ryan of Upton Financial Group, who is cited in the report.
Smaller businesses also tend to depend more heavily on their owners, which means more value is lost when the owner leaves the business. For more information on the report, go to: https://www.ibba.org/market-pulse
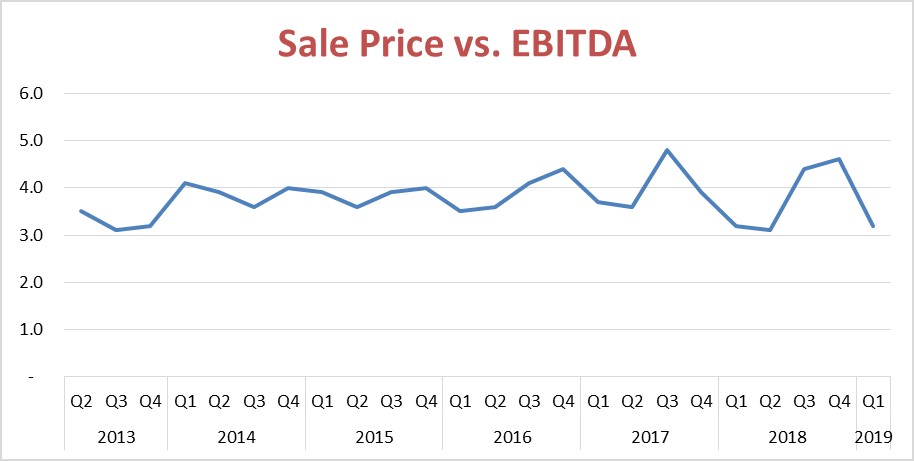
The relationship between EBITDA and sale price for private business transactions has grown more volatile over the past two years, according to the DealStats Value Index data for the first three months of 2019. Source: DealStats Value Index, 2Q 2019
Bargain shoppers took center stage during the first three months of the year, as EBITDA multiples for sales of private businesses dropped sharply, according to the latest edition of the DealStats Value Index.
The ratio of median selling price to EBITDA (earnings before interest, taxation, depreciation and amortization) fell during the first quarter to 3.2, from 4.6 during the final three months of 2018. It was the lowest level reported since the second quarter of 2018, when the median multiple hit a five-year low of 3.1.
DealStats is a database of private-company transactions maintained by Business Valuation Resources. Those transactions are used by business appraisers when applying the market approach to valuation. Multiples such as sale price-to-EBITDA can be derived from transactions involving similar businesses and used to estimate the value of a company.
Business appraisers use ratios such as price-to-EBITDA in roughly the same manner that home appraisers use price-per-square-foot – to create a ballpark estimate of value, subject to adjustments for unique features of the entity being valued.
Other popular ratios are price-to-sales, price-to-EBIT (earnings before interest and taxes, aka operating profit) and price-to-discretionary earnings. We could spend a full column discussing that last one; for now, think of it as the total benefits available to the business owner.
Rising margins
While the sale price-to-EBITDA multiple declined during the first quarter, another measure tracked by DealStats increased. EBITDA margin – the percentage of revenue represented by EBITDA – rose to 15 percent during the first quarter of 2019, up from 11 percent in the previous quarter. EBITDA margin and the sale price-to-EBITDA ratio tend to move in opposite directions.
In short, companies sold during the first three months of the year were more profitable (as measured by EBITDA) than those sold in the previous half-year, but sold at lower multiples of that enhanced profit level.
Increased volatility
The relationship between selling prices and EBITDA has grown more volatile over the past two years, after moving in a more narrow range from 2014 to mid-2017, according to the DealStats Value Index.
What is driving this increased volatility? Answering that is a little like trying to explain the stock market’s roller-coaster ride of the past year. If we could divine satisfactory solutions to these riddles, we’d be in a different line of work, perhaps reading Tarot cards or playing the ponies.
One factor that can create the appearance of volatility is a shift in the mix of businesses that sell from one quarter to the next. Companies in different industries tend to sell for distinct multiples. The ratio of sale price-to-EBITDA for finance and insurance companies, for instance, was 7.5 during the quarter, according to BVR, while the multiple for retail trade was 3.8. If a wave of consolidation hits retailers, it could skew the overall multiples without implying anything regarding the appropriate multiples for any given industry or business.
Think of it this way: If a developer came to town and built a few dozen pricey Colonials over a year or two, the median sale price for homes in your town might increase substantially. That would not necessarily mean that your humble split-level with its well-manicured lawn and partially obstructed mountain views had increased in value proportionately.
It remains to be seen if the recent drop in the EBITDA multiple and spike in volatility are temporary blips or signals of more sustained change. Stay tuned.