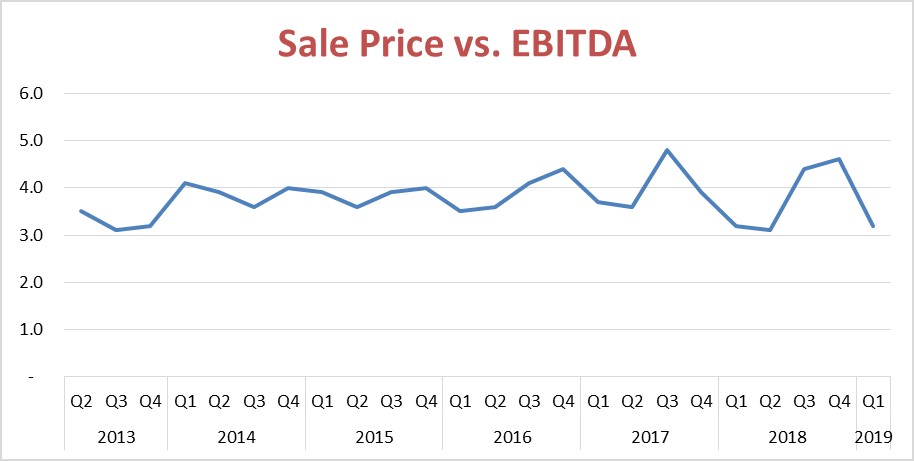
The relationship between EBITDA and sale price for private business transactions has grown more volatile over the past two years, according to the DealStats Value Index data for the first three months of 2019. Source: DealStats Value Index, 2Q 2019
Bargain shoppers took center stage during the first three months of the year, as EBITDA multiples for sales of private businesses dropped sharply, according to the latest edition of the DealStats Value Index.
The ratio of median selling price to EBITDA (earnings before interest, taxation, depreciation and amortization) fell during the first quarter to 3.2, from 4.6 during the final three months of 2018. It was the lowest level reported since the second quarter of 2018, when the median multiple hit a five-year low of 3.1.
DealStats is a database of private-company transactions maintained by Business Valuation Resources. Those transactions are used by business appraisers when applying the market approach to valuation. Multiples such as sale price-to-EBITDA can be derived from transactions involving similar businesses and used to estimate the value of a company.
Business appraisers use ratios such as price-to-EBITDA in roughly the same manner that home appraisers use price-per-square-foot – to create a ballpark estimate of value, subject to adjustments for unique features of the entity being valued.
Other popular ratios are price-to-sales, price-to-EBIT (earnings before interest and taxes, aka operating profit) and price-to-discretionary earnings. We could spend a full column discussing that last one; for now, think of it as the total benefits available to the business owner.
Rising margins
While the sale price-to-EBITDA multiple declined during the first quarter, another measure tracked by DealStats increased. EBITDA margin – the percentage of revenue represented by EBITDA – rose to 15 percent during the first quarter of 2019, up from 11 percent in the previous quarter. EBITDA margin and the sale price-to-EBITDA ratio tend to move in opposite directions.
In short, companies sold during the first three months of the year were more profitable (as measured by EBITDA) than those sold in the previous half-year, but sold at lower multiples of that enhanced profit level.
Increased volatility
The relationship between selling prices and EBITDA has grown more volatile over the past two years, after moving in a more narrow range from 2014 to mid-2017, according to the DealStats Value Index.
What is driving this increased volatility? Answering that is a little like trying to explain the stock market’s roller-coaster ride of the past year. If we could divine satisfactory solutions to these riddles, we’d be in a different line of work, perhaps reading Tarot cards or playing the ponies.
One factor that can create the appearance of volatility is a shift in the mix of businesses that sell from one quarter to the next. Companies in different industries tend to sell for distinct multiples. The ratio of sale price-to-EBITDA for finance and insurance companies, for instance, was 7.5 during the quarter, according to BVR, while the multiple for retail trade was 3.8. If a wave of consolidation hits retailers, it could skew the overall multiples without implying anything regarding the appropriate multiples for any given industry or business.
Think of it this way: If a developer came to town and built a few dozen pricey Colonials over a year or two, the median sale price for homes in your town might increase substantially. That would not necessarily mean that your humble split-level with its well-manicured lawn and partially obstructed mountain views had increased in value proportionately.
It remains to be seen if the recent drop in the EBITDA multiple and spike in volatility are temporary blips or signals of more sustained change. Stay tuned.