
Continued Volatility Seen in Latest Edition of Value Index

Price volatility continued in the small-business transaction market during the second quarter of 2019, according to the latest edition of DealStats Value Index.
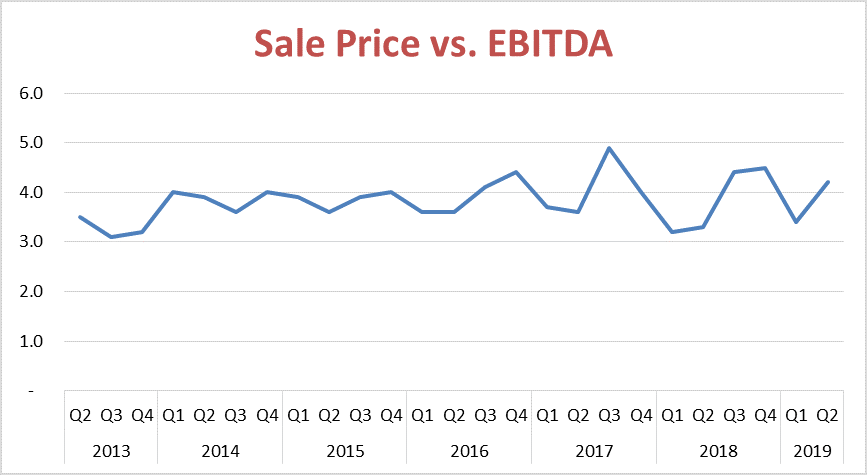
The median EBITDA multiple – the ratio of selling price to earnings before interest, taxes, depreciation and amortization – jumped to 4.2 for transactions completed in the second quarter, up from a median of 3.4 during the first three months of the year. That increase continued a trend of large quarterly swings that began during the second quarter of 2017.
DealStats is a database of private-company transactions maintained by Business Valuation Resources. The database is used by business appraisers when applying the market approach to valuation. Multiples such as sale price-to-EBITDA can be derived from transactions involving similar businesses and used to estimate the value of a company, subject to adjustments for unique characteristics of the company being valued.
Companies that sold during the second quarter were generally less profitable than those sold in the first quarter, according to Value Index. EBITDA represented 11 percent of revenue for second-quarter transactions, down from 15 percent for the first quarter of the year.
In short, transactions reported to DealStats for the second quarter featured companies that were less profitable (as measured by EBITDA) than those sold in the previous quarter, but they sold at higher multiples to the reduced earnings.
Not all sectors are created equal
What’s driving the increase in volatility? DealStats doesn’t offer any theories. One contributing factor could be a shift in the types of businesses sold from one quarter to the next. For instance, much has been written in recent years about consolidation in healthcare. Businesses in healthcare and social assistance sold at a median of 6.3 times EBITDA during the second quarter, among the highest multiples tracked by DealStats. Retailers, in contrast, sold for a median multiple of 3.8. A spate of medical practice mergers could drive up the overall multiple for a quarter. A run of retail acquisitions could drive it down.
The industries boasting the highest median EBITDA multiples during the second quarter were information at 11.1, and mining, quarrying and oil and gas extraction services at 8.3. The lowest EBITDA multiples were reported for transactions in accommodation and food services at 2.6, and other services at 3.0.
Size premium
The smallest of small businesses tend to enjoy the largest profit margins, but they garner the lowest multiples of that profit when they sell. The Value Index tracks this dynamic by dividing transactions into four groups based on net sales (less than $1 million, $1 million-$5 million, $5 million-$10 million and greater than $10 million).
Of those groups, businesses with less than $1 million in net sales have produced the highest net profit margins in each year since 2010, while businesses with sales of more than $10 million have generated the lowest margins in each year except 2011. This isn’t surprising, since the smallest businesses typically have limited overhead, and many are sole proprietorships with little payroll expense.
When small businesses are sold, however, the largest among them generate the highest price multiples. In 2018, the median ratio of selling price to EBITDA for businesses with sales greater than $10 million was a shade over 12, according to the Value Index. For those with sales of less than $1 million, the median was less than 4.
As we’ve noted before, larger businesses typically face less risk because they have more diversified products, vendors and customers. There’s an inverse relationship between risk and value. Larger businesses are rewarded with higher multiples in part because they are less risky.
Click below to read Advent’s recent article about size premiums in business valuation:
To learn more about Advent Valuation Advisors, email info@adventvaluecom.